
RWA Weekly — July 13, 2026
Tokenized RWA distributed value hits $34.29B as total holders cross one million for the first time; BNB Chain surges +19.30% WoW.
Yuri Konnov
TL;DR
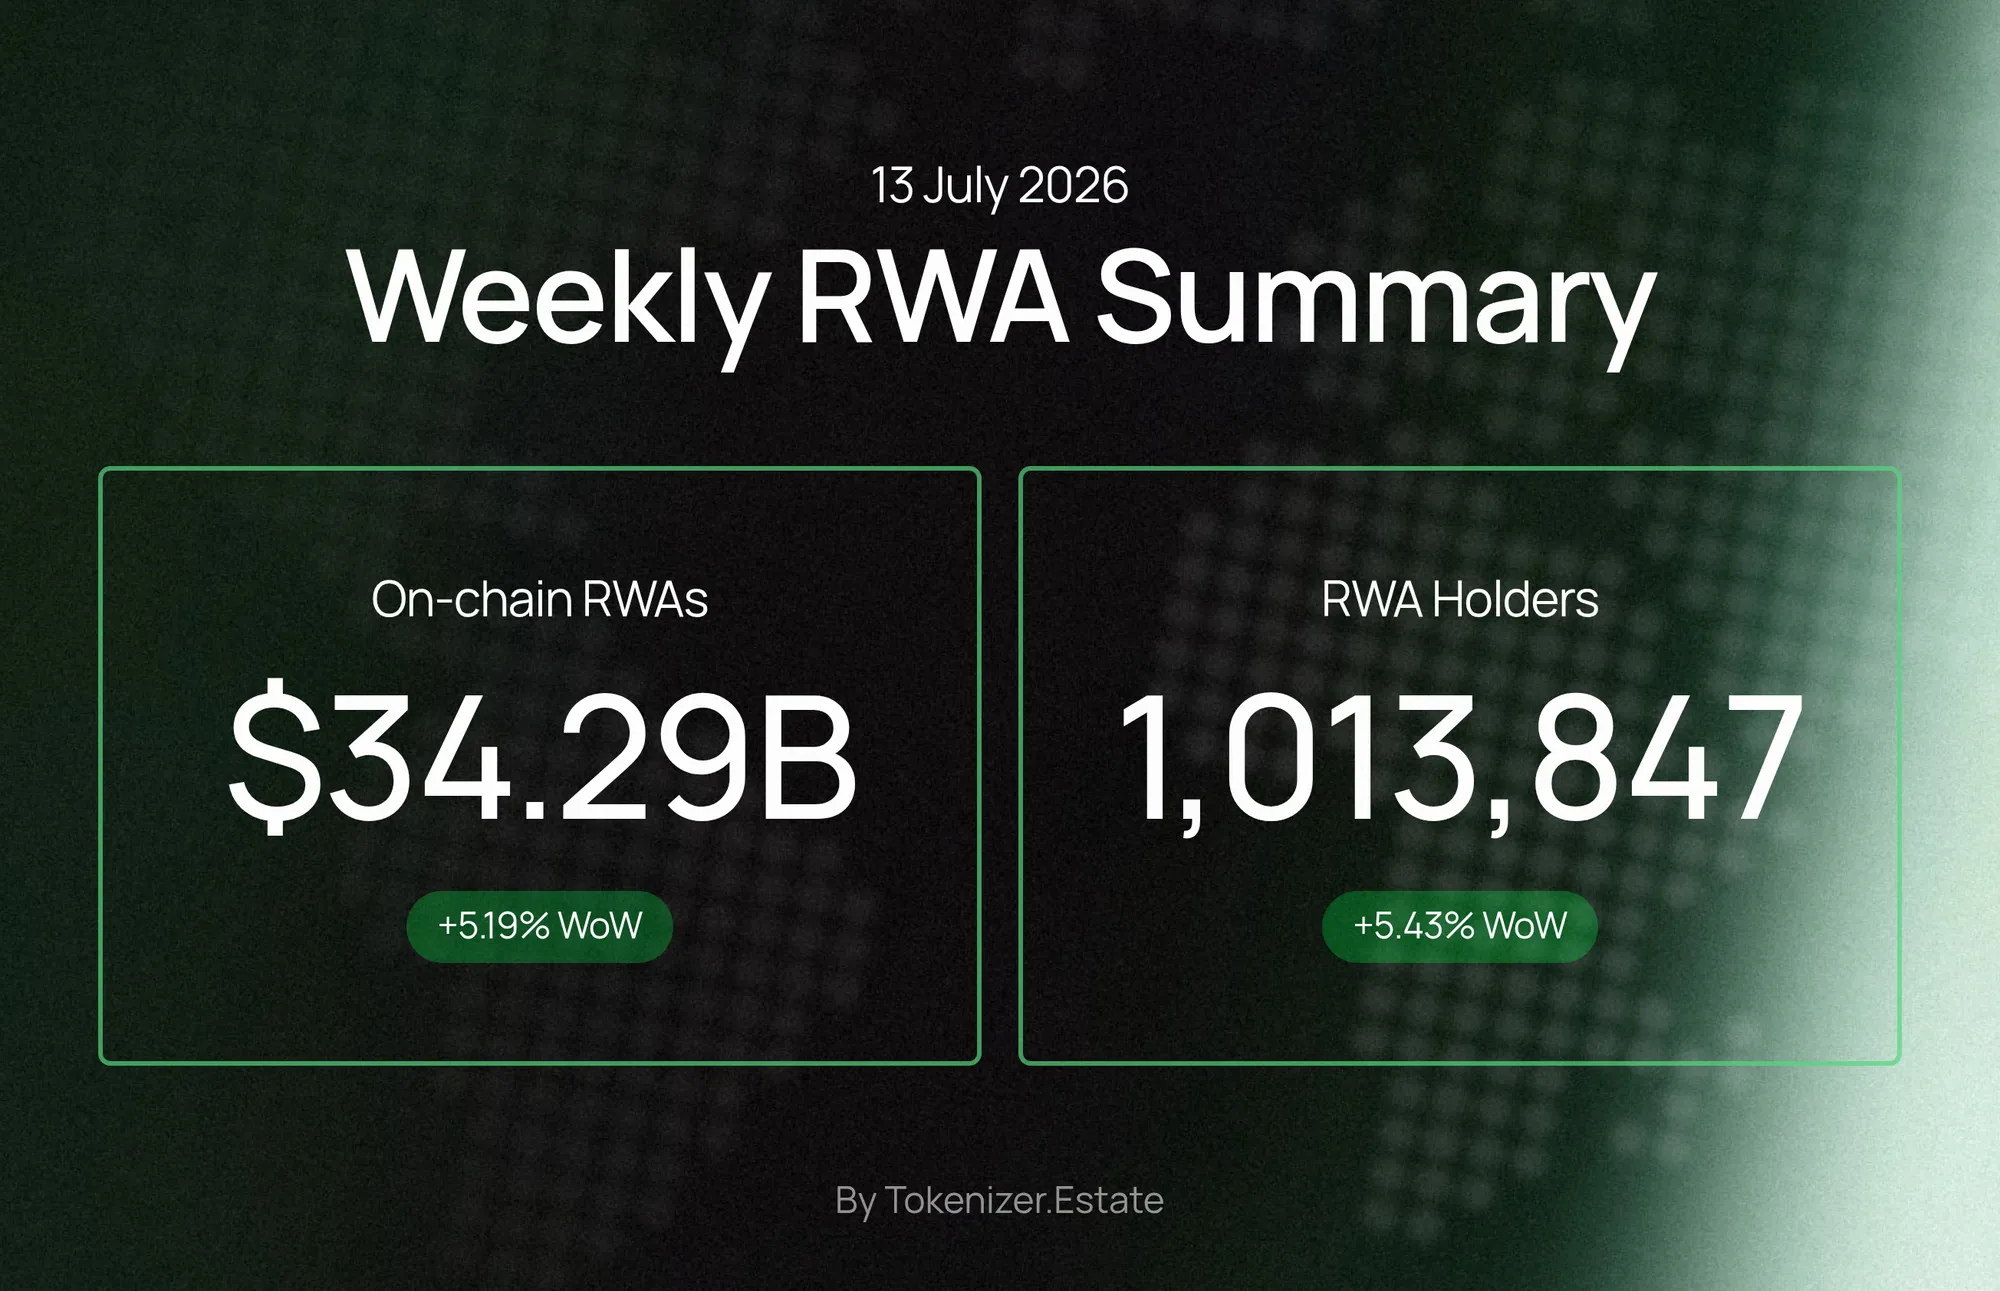
Distributed Asset Value: $34.29B — up $1.69B (+5.19%) week-over-week; accelerating.
Total Asset Holders: 1,013,847 — up 52,171 (+5.43%) week-over-week; expanding.
Active Networks: 38 — unchanged week-over-week; flat.
Stablecoin Value: $300.50B — up $5.22B (+1.77%) week-over-week; steady.
Market Snapshot
Metric | Value | 7-Day Change |
|---|---|---|
Distributed Asset Value | $34.29B | +$1.69B (+5.19%) |
Represented Asset Value | $374.94B | +$234.33B (+166.65%) |
Total Asset Holders | 1,013,847 | +52,171 (+5.43%) |
Active Networks | 38 | +0 (0.00%) |
Stablecoin Value | $300.50B | +$5.22B (+1.77%) |
Stablecoin Holders | 272,693,649 | +1,611,599 (+0.59%) |
Distributed RWA value grew at roughly three times the pace of stablecoin value this week (+5.19% vs. +1.77%), suggesting that capital formation in tokenized assets is outrunning the broader stablecoin base. The extraordinary +166.65% jump in Represented Asset Value warrants close monitoring in the weeks ahead, as it dwarfs the more measured growth in distributed and stablecoin metrics.
Chain Dynamics
Chain | RWA Value | Holders | WoW Value Change |
|---|---|---|---|
Ethereum | $29.42B | 25,350,537 | +$629.95M (+2.19%) |
Solana | $17.75B | 11,013,870 | +$495.70M (+2.87%) |
BNB Chain | $16.36B | 74,528,404 | +$2.65B (+19.30%) |
Arbitrum | $15.41B | 10,952,969 | +$720.61M (+4.91%) |
Avalanche C-Chain | $9.96B | 3,012,342 | +$1.04B (+11.62%) |
Ethereum retains the top position by RWA value at $29.42B, a lead it has held across all six weeks of available historical context. However, its week-over-week growth rate of +2.19% was the slowest among the top five chains, indicating that the marginal capital inflow is increasingly finding its way to other networks. BNB Chain posted the largest absolute gain this week at +$2.65B (+19.30%), closing the gap with Solana's $17.75B to just $1.39B.
Average position size — calculated as RWA value divided by holder count — reveals a sharp divergence in user profile across chains. Ethereum holders average approximately $1,161 per address, while Solana and Arbitrum holders average roughly $1,612 and $1,407 respectively. BNB Chain, despite its outsized value gain, carries the smallest average position at approximately $0.22 per holder, reflecting its very large retail holder base of 74,528,404. Avalanche C-Chain sits at approximately $3,306 per holder, the highest among the top five, pointing to a more concentrated or institutional-leaning participant set.
Arbitrum's +4.91% gain kept it within $1.59B of BNB Chain, and its holder count of 10,952,969 is broadly comparable to Solana's 11,013,870 — yet Arbitrum's value is $2.34B lower, implying a lower average position size. If BNB Chain's current growth rate persists, it could challenge Solana for second place within the coming weeks, making the BNB Chain trajectory one of the more consequential data points to track.
Notable Deals This Week
Dubai Puts Real Estate Title Deeds On-Chain — Dubai has recorded property title deeds on a blockchain, enabling fractional real estate ownership at scale, with a fractional apartment listing selling out in under two minutes. Read more
Tiger Research: Asset Tokenization Reshapes Capital Markets — Tiger Research published a long-form report tracing capital market infrastructure from 1996 to the present, arguing that asset tokenization represents a foundational shift in market rails. Read more
Binance Wallet Adds Plume Vault for Tokenized Funds — Binance Wallet integrated Plume's yield vault on July 8, 2026, giving users direct access to tokenized funds managed by Invesco and Bitwise. Read more
EU Plans MiCA Expansion for Tokenization and Stablecoins — The European Commission is planning to revise MiCA shortly after the regulation took full effect, targeting tokenized assets and non-EU stablecoin issuers. Read more
Solana RWA Transfer Volume Doubles, Hits $8.7B — Solana's real-world asset transfer volume more than doubled in 30 days, surpassing $8.7 billion according to RWA.xyz data. Read more
Commodities
Metric | Value | 7-Day Change |
|---|---|---|
Distributed Value | $4.60B | -$76.77M (-1.64%) |
Represented Value | $3.16B | +$40.84M (+1.31%) |
Total Value | $7.76B | -$35.92M (-0.46%) |
Monthly Transfer Volume | $4.39B | -$676.17M (-13.36%) |
Monthly Active Addresses | 36,827 | +4,698 (+14.62%) |
Holders | 239,163 | -6,600 (-2.69%) |
Top issuers by total value: Tether Holdings ($2.98B), Justoken ($2.88B), Paxos ($1.85B), Ctrl Alt ($280.71M), Backed Assets ($147.63M).
Commodities present a notable divergence this week: monthly transfer volume fell sharply by -$676.17M (-13.36%) while monthly active addresses rose by +4,698 (+14.62%). This suggests that a broader but lower-value participant base drove on-chain activity — more addresses transacting smaller amounts. The distributed/represented split ($4.60B vs. $3.16B) shows that on-chain distributed value continues to exceed represented value, with the distributed side softening slightly (-1.64%) while represented value edged up (+1.31%), a mild compression of the gap between the two measures.
Tokenized Real Estate
Metric | Value | 7-Day Change |
|---|---|---|
Distributed Value | $202.63M | -$55.68K (-0.03%) |
Represented Value | $279.84M | -$2.10 (-0.00%) |
Total Value | $482.47M | -$55.68K (-0.01%) |
Holders | 18,710 | +15 (+0.08%) |
Monthly Active Addresses | 1,088 | -145 (-11.76%) |
Assets | 104 | +0 (0.00%) |
Countries | 11 | +0 (0.00%) |
Tokenized real estate spans 104 assets across 11 countries, with a total value of $482.47M. The average asset size — total value divided by asset count — stands at approximately $4.64M per asset, reflecting a market composed predominantly of mid-scale individual property tokens rather than large institutional portfolios. The asset count and country footprint were both unchanged this week, indicating that the current inventory is consolidating rather than expanding.
Holder growth was marginal at +15 (+0.08%), bringing the total to 18,710. More notable is the -11.76% decline in monthly active addresses to 1,088, which implies that a significant portion of holders are in a passive, hold-only posture. With 18,710 holders and only 1,088 active addresses in the past month, fewer than 6% of holders transacted — a pattern consistent with real estate's characteristic low-turnover nature, but one that also limits observable price discovery on-chain.
The Dubai title deed development reported this week is directly relevant here: the recording of property title deeds on-chain with fractional ownership — where a listing sold out in under two minutes — represents a qualitatively different model from the current 104-asset, 11-country inventory. If similar jurisdictional frameworks emerge, the asset count and country metrics, both flat this week, could see meaningful expansion in subsequent reporting periods.
Editor's Take
The crossing of the one-million holder threshold — 1,013,847 total asset holders as of July 13 — is a structural milestone that reflects six consecutive weeks of holder growth, from 887,549 on June 8 to the current figure. That trajectory has been consistent even through the distributed value dip recorded in the week of June 29, suggesting that participant accumulation is decoupled from short-term value fluctuations. The more pressing question is whether the +166.65% surge in Represented Asset Value signals a genuine step-change in off-chain asset registration or a data reclassification event — the distributed value's comparatively modest +5.19% gain does not corroborate a move of that magnitude in underlying asset flows.
BNB Chain's +19.30% value gain in a single week is the kind of move that reshapes the competitive landscape among chains, and Avalanche's +11.62% is similarly outsized. If either rate sustains for two to three more weeks, the current top-five ordering will look materially different. Meanwhile, commodities' transfer volume contraction alongside active address expansion is a pattern worth watching: it may indicate fragmentation into smaller transaction sizes, which could reflect either broader retail participation or reduced institutional flow. Next week, the key metrics to track are whether BNB Chain's growth rate normalises or continues to compress the gap with Solana, and whether the Represented Asset Value figure stabilises or corrects toward the distributed value baseline.